
What is Magnetic Resonance Spectroscopy?
The electromagnetic radiation produced by any substance is dependent on its atomic composition. Spectroscopy is the determination of this chemical composition of a substance by observing the spectrum of electromagnetic energy released from chemical sample or a tissue.
Nuclear magnetic resonance spectroscopy, most commonly known as NMR spectroscopy, is the name given to a technique which exploits the magnetic properties of certain nuclei. The most important applications for the organic chemist are proton NMR and carbon-13 NMR spectroscopy. In principle, NMR is applicable to any nucleus possessing spin.
Initial NMR experiments were done by Rabi and co-workers in 1938. These efforts were acknowledged by the Nobel Prize in 1944. Later Purcell and Bloch (1952) first detected NMR signals from magnetic dipoles of nuclei when placed in an external magnetic field. The first NMR imaging was performed in 1970 on animals followed by human application developed by Dr. Damadian in 1980, who introduced the first commercial MRI scanner. Parallel to the introduction of magnetic resonance imaging (MRI) to clinical practice, initial in vivo brain spectroscopy studies were done in the early 1980s. Magnetic resonance spectroscopy (MRS) has rapidly progressed in its clinical utility and recognition. Today, MRS has become a significant non-invasive diagnostic tool and has gained wide clinical acceptability.
MRS Technique
MRS can be performed by two methods–single-voxel spectroscopy (SVS), where a single sample volume is selected and a spectrum obtained from it, or multi-voxel spectroscopy where spectra are obtained from multiple voxels in a single slab of tissue. SVS gives a better signal-to-noise ratio and is a more robust technique. The disadvantage is that only a single spectrum is obtained. The placement of the volume of interest (VOI) becomes critical and may lead to errors of interpretation if not done correctly.
With multi-voxel MRS, a much larger area can be covered, eliminating the sampling error to an extent. This, however, is done at the expense of a significant weakening in the signal-to-noise ratio and a longer scan time. Both SVS and multi-voxel imaging utilize specialized MR pulse sequences. The two most widely used are the Point Resolved Excitation Spin-echo Sequence (PRESS) and the STimulated Echo Acquisition Mode (STEAM) technique. Details of both these techniques are beyond the scope of this article.
Brain Metabolites Identified with MRS
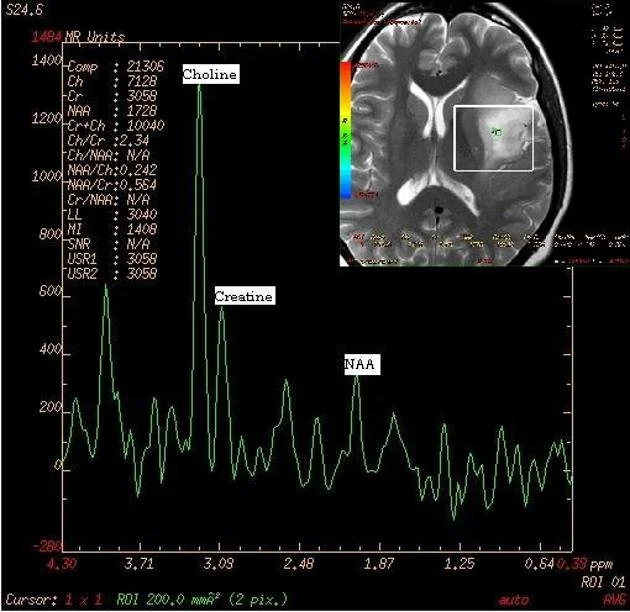
MRS provides biochemical information of compounds present in human tissue and cells. Human brain contains hundreds of metabolites but proton MRS can only detect a few of them as least multi-molar concentrations are necessary for the metabolites to be detected. The major brain metabolites detected are choline (Cho), creatine (Cr), N-acetyl aspartate (NAA), lactate, myo-inositol, glutamine and glutamate, lipids, and the amino acids leucine and alanine.
N-Acetyl Aspartate (NAA) is an amino acid found exclusively in neurons. It is regarded as a non-specific marker and is thought to be involved in Coenzyme A interactions and lipogenesis within the brain. It is a marker of neuronal viability. Normal NAA concentration is in the range of 8-9 mmol/kg in healthy adult brain. Concentrations are decreased in conditions leading to axonal injury or neuronal loss. NAA is also decreased in other conditions such as neoplasm, infarction, and inflammatory conditions such as multiple sclerosis. NAA peak is seen at 2.0 ppm (parts per million) on MR spectra.
The Choline (Cho) peak is a heterogeneous peak representing various choline-containing compounds such as acetylcholine, phosphocholine (lecithin), glycerophosphocholine, and various other intermediates of phospholipids metabolism. It is an indicator of cell density and cell wall turnover. Elevated levels are found in some tumors, especially malignant ones, and in certain demyelinating diseases. Choline resonance presents at 3.22 ppm. Studies have shown there is also a direct association between Cho and levels of Ki-67, a protein expressed in all phases of the cell cycle except GO that serves as a good marker for cellular proliferation. This observation makes Cho a reliable predictor of cellular activity in tumor tissue.
Creatine (Cr) is basically related to cell energy pathways. It is both the substrate and product of creatine kinase. Creatine reflects the energy potential available in brain tissue. Its concentration in normal brain remains very high and stable due to high metabolic energy needs of brain cells. Its peak is noticed at 3.0 ppm. Creatine-Choline ratios are an important indicator of disease states such as demyelization.
Lactate (Lac) is absent in normal brain tissue and its presence is indicative of anerobic glycolysis at the cellular level. Elevated levels are associated with ischemic conditions or metabolic disorders (where anerobic glycolysis predominates) but is also noted at the edges of large brain tumors. The peak is very sensitive to the technique employed and unless the correct echo time is employed, it may be artifactually suppressed particularly at high field strengths. The spectral peak lies at 1:33 ppm. The peak is often inverted or bifid.
Lipid is also absent normally but can increase in tumors, infections or metabolic conditions. The peak is at 1.3 ppm and overlaps with lactate peak; the two metabolites can be distinguished by inversion of the lactate peak at intermediate echo times.
Myo-inositol (Ins) is a naturally occurring sugar. It is the dominant peak in newborn brains and lies at 3.56/4.06 ppm. It is regarded as an astrocytic marker and is a possible marker for intracellular osmotic integrity. Its concentration is decreased in stroke, tumors, lymphoma and some low-grade malignancies.
Glutamate/Glutamine/GABA are neurotransmitters and act as markers for neuronal-glial interaction. Peaks lie at 2-2.5 and 3.4-3.7 ppm.
2-hydroxyglutarate is a metabolite that accumulates in IDH-1 mutated brain tumors and can potentially be used as a noninvasive marker of this mutation, with peaks at 4.02, 2.25 and 1.90 ppm. Detection of this metabolite is challenging due to overlap with other metabolites, and can require post-processing beyond that typically used in clinical practice.
Gharzeddine K, Hatzoglou V, Holodny AI, Young RJ. “MR perfusion and MR spectroscopy of brain neoplasms.” Radiologic Clinics of North America. 2019; 57(6): 1177-88.
Choi C, Ganji SK, DeBerardinis RJ, Hatanpaa KJ, Rakheja D, Kovacs Z, Yang XL, Mashimo T, Raisanen JM, Marin-Valencia I, Pascual JM, Madden CJ, Mickey BE, Malloy CR, Bachoo RM, Maher EA. “2-hydroxyglutarate detection by magnetic resonance spectroscopy in IDH-mutated patients with gliomas.” Nature Medicine. 2012; 18:624-9.
Wilson M, Andronesi O, Barker PB, Bartha R, Bizzi A, Bolan PJ, Brindle KM, Choi IY, Cudalbu C, Dydak U, Emir UE, Gonzalez RG, Gruber S, Gruetter R, Gupta RK, Heerschap A, Henning A, Hetherington HP, Huppi PS, Hurd RE, Kantarci K, Kauppinen RA, Klomp DWJ, Kreis R, Kruiskamp MJ, Leach MO, Lin AP, Luijten PR, Marjańska M, Maudsley AA, Meyerhoff DJ, Mountford CE, Mullins PG, Murdoch JB, Nelson SJ, Noeske R, Öz G, Pan JW, Peet AC, Poptani H, Posse S, Ratai EM, Salibi N, Scheenen TWJ, Smith ICP, Soher BJ, Tkáč I, Vigneron DB, Howe FA. Methodological consensus on clinical proton MRS of the brain: Review and recommendations. Magn Reson Med. 2019 Aug;82(2):527-550.
Harris AD, Saleh MG, Edden RA. Edited 1 H magnetic resonance spectroscopy in vivo: Methods and metabolites. Magn Reson Med. 2017 Apr;77(4):1377-1389.
Astrakas LG, Argyropoulo MI. “Key concepts in MR spectroscopy and practical approaches to gaining biochemical information in children.” Pediatric Radiology. 2016; 46: 941-951.
Rapalino O, Ratai EM. “Multiparametric imaging analysis: magnetic resonance spectroscopy.” Magnetic Resonance Imaging Clinics of North America. 2016; 24(4)671-86.
Ratai EM, Gilberto Gonzalez R. Clinical magnetic resonance spectroscopy of the central nervous system. Handbook of Clinical Neurology. 2016; 135:93-116.
Wang Q, Zhang H, Zhang J, Wu C, Zhu W, Li F, Chen X, Xu B. The diagnostic performance of magnetic resonance spectroscopy in differentiating high- from low-grade gliomas: a systematic review and meta-analysis. European Radiology. 2016; 26:2670-2684.
Quarantelli M. MRI/MRS in neuroinflammation: methodology and applications. Clin Transl Imaging. 2015;3(6):475-489.
Stadlbauer A, Gruber S, Nimsky C, Fahlbusch R, Hammen T, Buslei R,Tomandi B, Moser E, Ganslandt O. “Pre-Operative grading of gliomas by using metabolite quantification with High–Spatial–Resolution Proton MR Spectroscopic imaging. Radiology 2006; 238: 958-969.
Weybright P, Sundgren P, Maly P, Hassan D, Nan B, Rohrer, S, Junck L, “Differentiation between brain tumour recurrence and radiation injury using MR spectroscopy.” American Journal Roengenol 2005; 185:1471-1476.
Galanaud D, Chinot O, Nicoli F, Confort-Gouny S, Fur Y, Barrie-Attarian M, Ranjeva J, Fuentes S, Viout, P. Figarella-Branger, D. Cozzone, P. “Use of proton magnetic resonance spectroscopy of the brain to differentiate gliomatosis cerebri from low-grade glioma.” J Neurosurg. 2003; 98: 269-276.
Law M, Cha S, Knopp E, Johnson G, Arnett J, Litt A. “High-grade gliomas and solitary metastases: Differentiation by using perfusion and proton spectroscopic MR imaging.” Radiology. 2002; 222: 715-721.
Gupta R, Vastal D, Husain N, Chawla S, Prasad K, Roy R, Kumar R, Jha D, Husain M. “Differentiation of tuberculous from pyogenic brain abscesses with in vivo proton MR spectroscopy and magnetization transfer MR imaging. AJNR. 2001; 22: 1503-1509.